Visualise Event Logs to Identify Compromised Accounts - LogonTracer -
Hello again, this is Shusei Tomonaga from the Analysis Center.
Event log analysis is a key element in security incident investigation. If a network is managed by Active Directory (hereafter, AD), can be identified by analysing AD event logs. For such investigation, it is quite difficult to conduct detailed analysis in AD event viewer; it is rather common to export the logs to text format or import them into SIEM/log management system. However, since the amount of event logs can be massive depending on the environment, this can be a struggle for analysts.
JPCERT/CC has developed and released a tool “LogonTracer” which supports such event log analysis. This entry introduces how it works and how to launch it.
Event Log Visualisation by LogonTracer
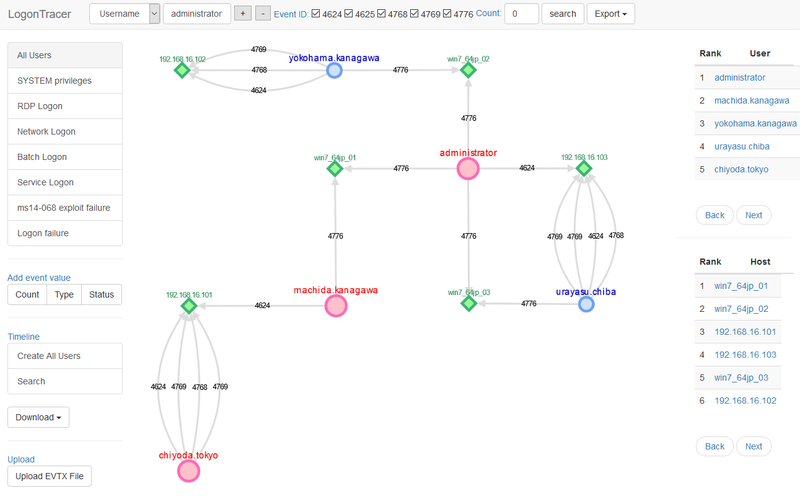
LogonTracer associates a host name (or an IP address) and account name found in logon-related events and displays it as a graph. This way, it is possible to see in which account login attempt occurs and which host is used. Figure 1 is a graph created by LogonTracer, which shows the relations of some IP addresses and accounts.
 |
Here are the details of each node. An account (Red/Blue) that is connected to a host (Green) with a line shows that it is logged on using the host.
- Red: SYSTEM privilege account
- Blue: Standard user account
- Green: Host/IP address
This visualisation makes the analysis simple even for those without detailed knowledge about event logs.
Extract More Important Accounts and Hosts
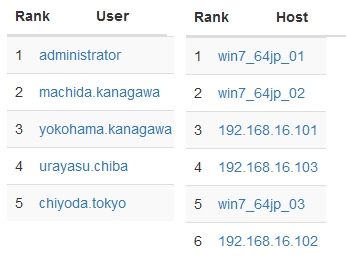
In addition to event log visualisation, LogonTracer is able to display possibly leveraged accounts/hosts by ranking. Figure 2 is an example of importance rank of accounts and hosts.
 |
For this ranking, LogonTracer performs network analysis on the event log graph, and creates a ranking based on the “centrality” of each node. Centrality is an index which indicates each node’s proximity to the centre in a network. For calculation of centrality, PageRank [1] is applied. In this algorithm, nodes that have connection to many other nodes are located towards the centre of the graph and therefore have a higher centrality.
As compromised accounts are used to perform login attempts to many hosts, they tend to have a higher centrality. Consequently, by comparing the centrality, possibly affected accounts/hosts can be identified.
Chronological Display of Event Logs
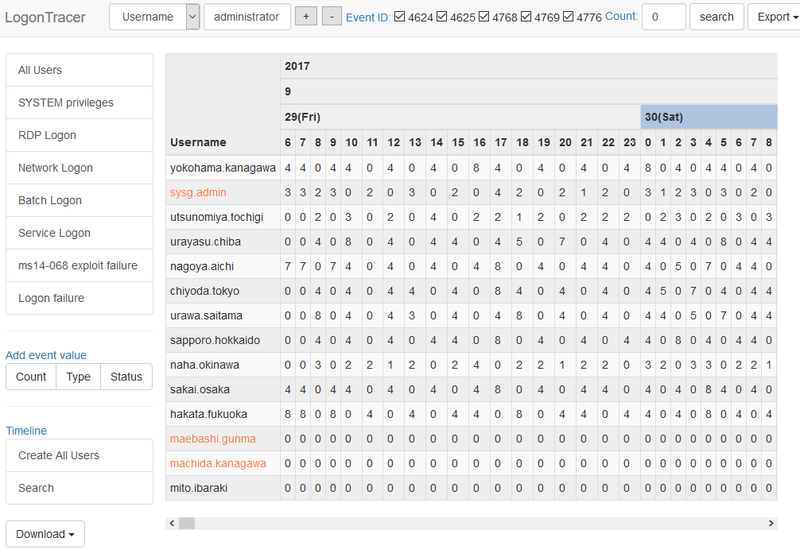
With LogonTracer, it is also possible to display event logs in a chronological order. Figure 3 shows the number of event logs for each account in a time series.
 |
By checking the number of logs in the course of time, unauthorised logon attempts during a short period of time or outside of working hours can be spotted.
Drastic increase of event logs is automatically highlighted. For detecting the increase of the count, Change Finder [2] is applied as an anomaly detection method.
How to Install LogonTracer
This tool is available on GitHub. You can download it from the following webpage:
JPCERTCC GitHub - LogonTracer
https://github.com/JPCERTCC/LogonTracer
Here is the instruction on how to use LogonTracer. The tool was tested on a Linux environment.
- Obtain and install Neo4j community edition
Download Neo4j community edition from the below website and install it:
https://neo4j.com/download/other-releases/#releases
- Download LogonTracer
Download from the below webpage and deploy it in a folder.
https://github.com/JPCERTCC/LogonTracer
- Install Neo4j JavaScript driver
Install Neo4j JavaScript driver in static folder of LogonTracer.
$ cd LogonTracer/static
$ npm install neo4j-driver- Install Python module
Install Python module for LogonTracer
$ pip install -r requirements.txt*If statsmodels installation fails, install numpy first.
- Launch Neo4j
Launch Neo4j by GUI or command line.
How to use LogonTracer
Launch LogonTracer using the below option:
$ python3 logontracer.py -r -o [PORT] -u [USERNAME] -p [PASSWORD] -s [IP Address]- -r: Launch web server
- -o: Port number where the web server operates (ex: 8080)
- -u: Neo4j username (“neo4j” by default)
- -p: Neo4j password
- -s: Address where the web server operates (ex: localhost)
Below is an example of executing LogonTracer.
 |
To access the web interface, please go to the below URL from your browser. (In this environment, LogonTracer was installed in a local environment and runs on the port 8080).
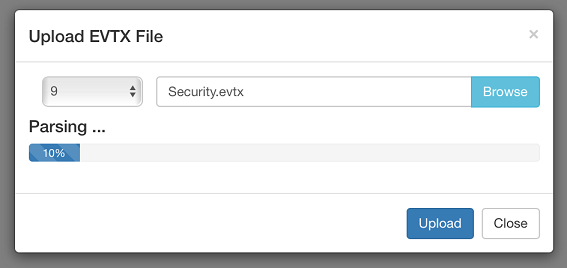
http://localhost:8080/To import logs, you can upload in EVTX format.
 |
How to Use Docker Image
Docker image of LogOnTracer is available on Docker Hub.
https://hub.docker.com/r/jpcertcc/docker-logontracer/
If using Docker, the image can be launched by the following command:
$ docker run \
   --detach \
   --publish=7474:7474 --publish=7687:7687 --publish=8080:8080 \
   -e LTHOSTNAME=[IP Address] \
   jpcertcc/docker-logontracer
Event Logs that LogonTracer can Analyse and Points to Note
A research conducted by JPCERT/CC “Detecting Lateral Movement in APTs” identifies that monitoring the following events is effective in investigating unauthorised logon. Based on that, LogonTracer is also designed to visualise the following event IDs for visualization:
- Event ID 4624: Login successful
- Event ID 4625: Login failed
- Event ID 4768: Kerberos authentication (TGT request)
- Event ID 4769: Kerberos authentication (ST request)
- Event ID 4776: NTLM authentication
- Event ID 4672: Privilege assignment
Because not all of the above event IDs are recorded with the default settings, Audit Policy needs to be enabled to retain such logs. We recommend enabling Audit Policy. For detailed instructions on the configuration, please see “Readme” of LogonTracer, which is also available on GitHub.
Conclusion
Although event logs analysis is crucial in incident investigation, it can be a time-consuming process if you do not know what to analyse and where to begin. This tool offers easy event log analysis by visualising the relations among accounts and hosts. We hope that you try this tool in preparation to actual incident investigation.
We will update soon with more information on how to conduct actual analysis using this tool.
Thank you for reading.
- Shusei Tomonaga
(Translated by Yukako Uchida)
Reference
[1] Wikipedia: PageRank
https://en.wikipedia.org/wiki/PageRank
[2] IEEE: A unifying framework for detecting outliers and change points from time series
http://ieeexplore.ieee.org/document/1599387/
Update (Nov 7, 2018)
Multiple vulnerabilities were found in LogonTracer prior to v1.2.1.
If you are using any of the old versions, please update to the latest version.
Multiple vulnerabilities in LogonTracer
https://jvn.jp/en/vu/JVNVU98026636/index.html
Release v1.2.1 - JPCERTCC/LogonTracer - GitHub
https://github.com/JPCERTCC/LogonTracer/releases/tag/v1.2.1
[Acknowledgement]
We thank Shoji Baba, Kobe Digital Labo Inc for helping us to fix these issues.

