ETW Forensics - Why use Event Tracing for Windows over EventLog? -
Many people may think of EventLogs when one mentions Windows OS logs. When investigating incidents such as malware infections, it is common to analyze the Windows OS EventLogs to find traces that may help uncover the incident. However, since the EventLog is not designed to detect suspicious behavior on Windows OS, you may not always find the information you are looking for when investigating an incident. Therefore, it is necessary to enable audit logs or install Sysmon to obtain more information.
There is another mechanism in Windows OS that can detect suspicious behavior. It is a feature called Event Tracing for Windows (ETW). This is a system for managing events generated by the kernel and processes, and it is used for debugging applications and other purposes. ETW is also used for collecting and managing EventLogs, and in recent years it has been used in the detection logic of EDR products and antivirus software. ETW has a function that can log various behaviors in the OS as events by default, which makes it possible to obtain more information than EventLogs.
This article explains the structure of ETW and how you can use it for your forensics.
ETW Internals
ETW architecture
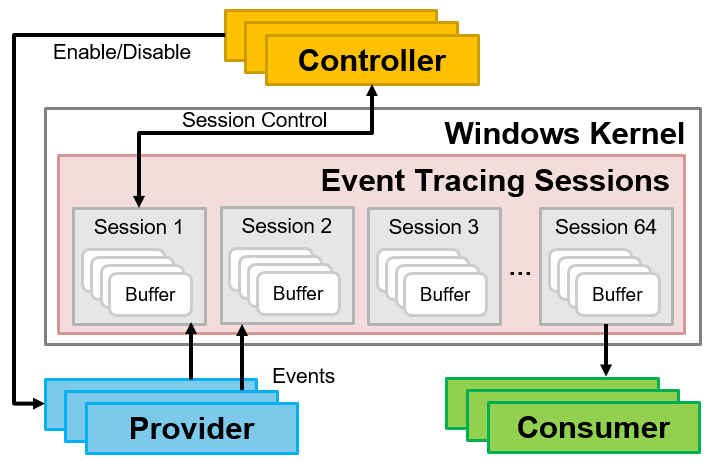
Figure 1 shows the components of ETW[1]. Providers such as applications send events, and after they are stored in buffers, consumers such as EDR receive them.
- Provider: Applications and drivers that send events
- Consumer: Applications that receive events
- Session: Relays events sent from the provider, storing them in a buffer
- Controller: Creates, starts, and stops sessions (logman command[2]has controller functionality)
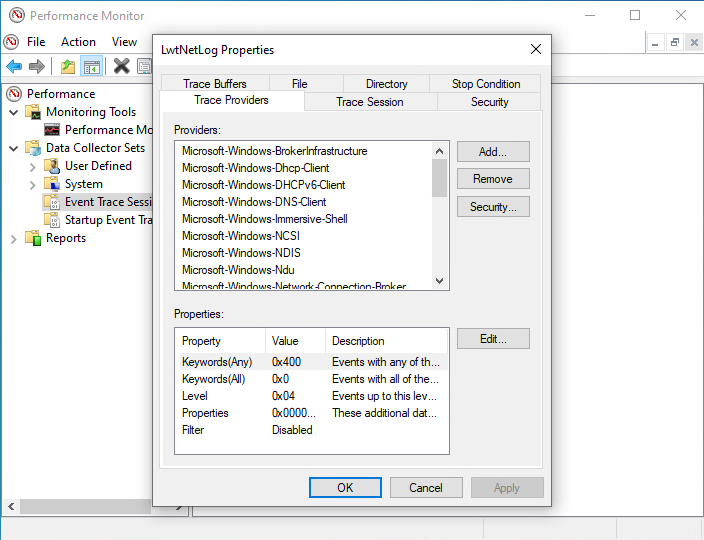
You can check ETW sessions from the Performance Monitor. It also allows you to create new sessions and prepare for event collection. As shown in Figure 2, multiple providers can be registered in a single session.
You can also check which providers are registered on Windows OS by executing the following command. By default, more than 1,000 providers are registered.
> logman query providers
With so many providers available by default, you probably thought that you would be able to collect various logs by using them. In particular, for the purposes of incident investigation and detecting suspicious behavior such as malware, the following providers would be useful.
- Microsoft-Windows-Threat-Intelligence: Detects behavior related to process injection, etc., which is used by malware.
- Microsoft-Windows-DNS-Client: Events related to name resolution
- Microsoft-Antimalware-AMFilter: Results of virus scans by Microsoft Defender
- Microsoft-Windows-Shell-Core: Events related to process execution and termination
- Microsoft-Windows-Kernel-Process: Events related to processes
- Microsoft-Windows-Kernel-File: Events related to file operations
ETW event format
There are two main ways for processing ETW events (Stream Mode). One of them is to save ETW events as an ETL file, and the other is to save ETW events in a buffer and receive them in real time. In both cases, ETW events are saved in the same format. Figure 3 shows the format of ETW events.
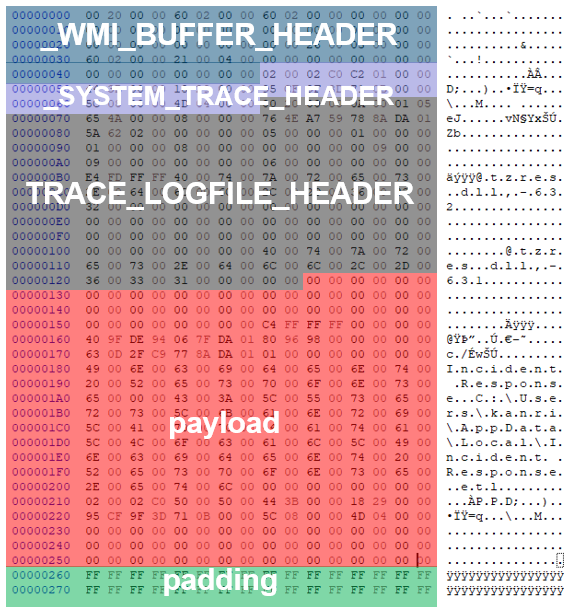
It starts with the _WMI_BUFFER_HEADER[3]. This header contains information such as the buffer size and offset, and the date and time the event was created. The next header depends on the contents that follow. In the case of an ETL file, the _SYSTEM_TRACE_HEADER and _TRACE_LOGFILE_HEADER follow. If these headers are included, this indicates that it is the beginning of the ETL file and that no further ETW events are included. If ETW events are included, it will look like Figure 4.
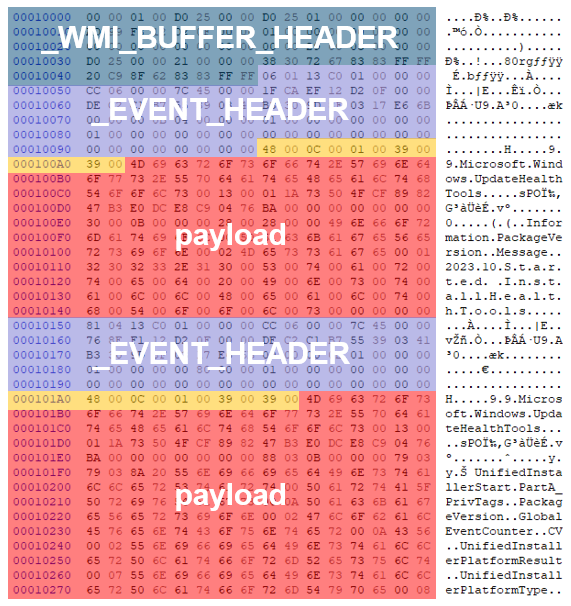
The first part of the header still starts with _WMI_BUFFER_HEADER, but the next header is _EVENT_HEADER, followed by the actual event data.
It is difficult to parse ETW events manually because they have no signature and the type information contained in each header affects the headers that follow, as described above. On Windows OS, you can convert ETL files to EVTX files or CSV files as follows, because the tracerpt command is installed by default.
> tracerpt test.etl -o test.evtx -of EVTX -lr

> tracerpt test.etl -o test.csv -of CSV
ETW structure
You can check ETW configuration information to some extent using the performance monitor, logman command, and registry information introduced earlier. However, not all of the information can be checked using these methods, and you can also obtain various types of information from the ETW structure. However, it cannot be obtained in user mode, and so you will need to obtain it from kernel mode using a debugger or other method. You can trace the structure of ETW providers as shown in Figure 5.
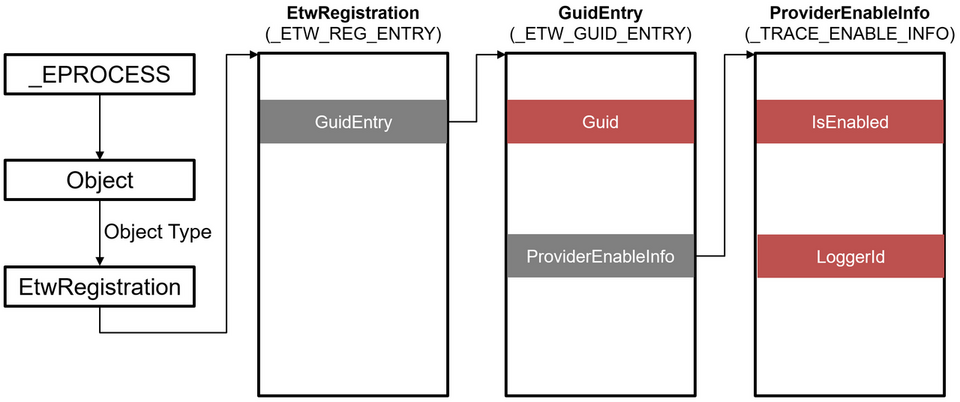
The structure of the ETW provider can be traced from an object with EtwRegistration object type in the process, and _ETW_GUID_ENTRY and _TRACE_ENABLE_INFO contain information such as GUID. Therefore, you can check which process is using which ETW provider. The structure of the ETW consumer can be traced as shown in Figure 6.
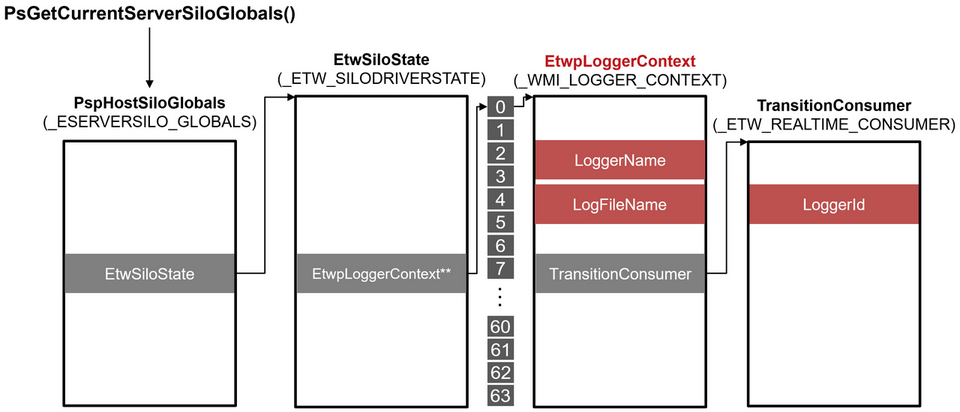
You can trace the structure of the ETW consumer from the data obtained from the PsGetCurrentServerSiloGlobals function. _WMI_LOGGER_CONTEXT and _ETW_REALTIME_CONSUMER contain various information, and you can check the buffer size, current buffer usage, number of lost events, and more.
Recover ETW Events
Relations between ETW events and ETW structures
Some ETW events are saved as files by default, but in many cases, they are read from the buffer into the ETW consumer in real time, and so unless you configure them manually, most of them are not saved on the system as files. However, since ETW events are stored in the buffer, if you can collect the data, you may be able to use it for incident response or other purposes. Furthermore, even if the ETL file is deleted by the attacker, the ETW events may still be stored in the buffer.
As mentioned earlier, the ETW event format has no signature and cannot be recovered from disk or memory using file carving. For this reason, we explored methods to extract data from ETW structure.
As a result, we have identified the members of the structure that store ETW events as follows:
- GlobalList(_WMI_LOGGER_CONTEXT)
- BufferQueue(_WMI_LOGGER_CONTEXT)
- BatchedBufferList(_WMI_LOGGER_CONTEXT)
- CompressionTarget(_WMI_LOGGER_CONTEXT)
- UserBufferListHead(_ETW_REALTIME_CONSUMER)
GlobalList and BufferQueue are LIST_ENTRY, and the ETW events stored in the buffer are connected as a bi-directional linked list as shown in Figure 7. All the ETW events in the buffer are connected to GlobalList.
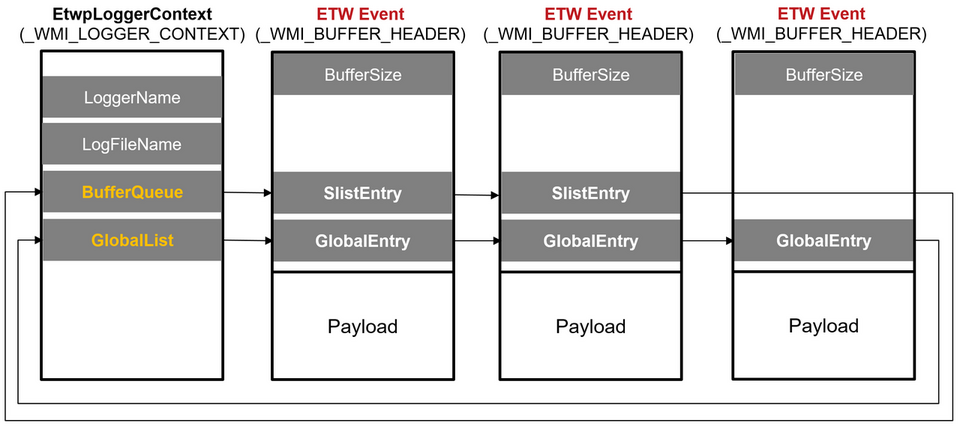
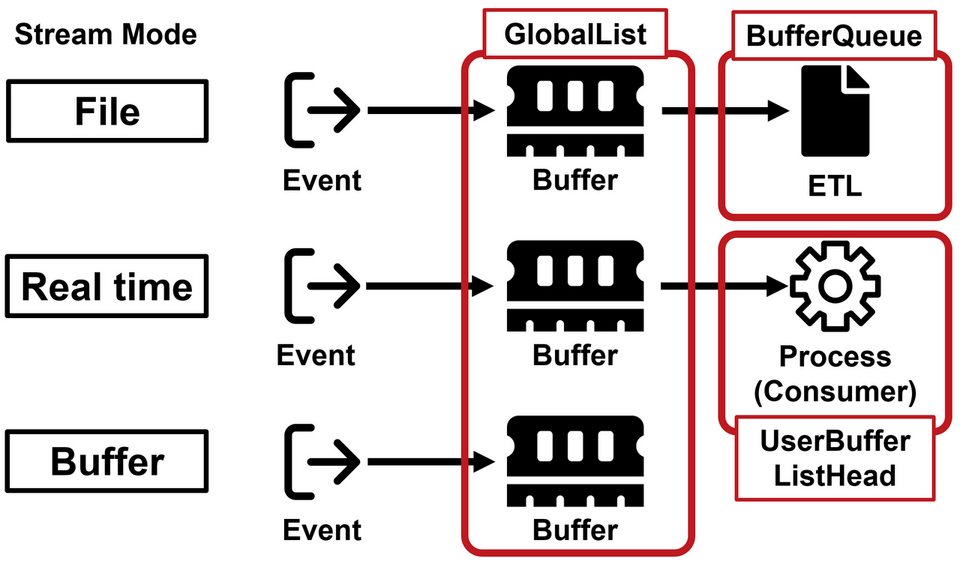
Because ETW structures are undocumented, it is not clear exactly why multiple members are related to the buffer in this way, but based on the behavior, it is possible that the ETW Stream Mode configuration affects it. Figure 8 shows the members considered to be related to each ETW Stream Mode. When it is set to save to an ETL file, BufferQueue is used, and when it is set to Real time, UserBufferListHead is used. Although there are differences in usage depending on the member, all ETW events are linked to GlobalList, and so it is probably best to refer to GlobalList when recovering ETW events.
ETW Scanner for Volatility3
Based on the above research results, we have created a tool for recovering ETW events from memory images. This is implemented as a plugin for The Volatility Framework (hereinafter referred to as "Volatility"), a memory forensics tool. Using this plugin, you can not only recover ETW events, but also check information about ETW providers and ETW consumers. Figure 9 shows an example of the plugin running.
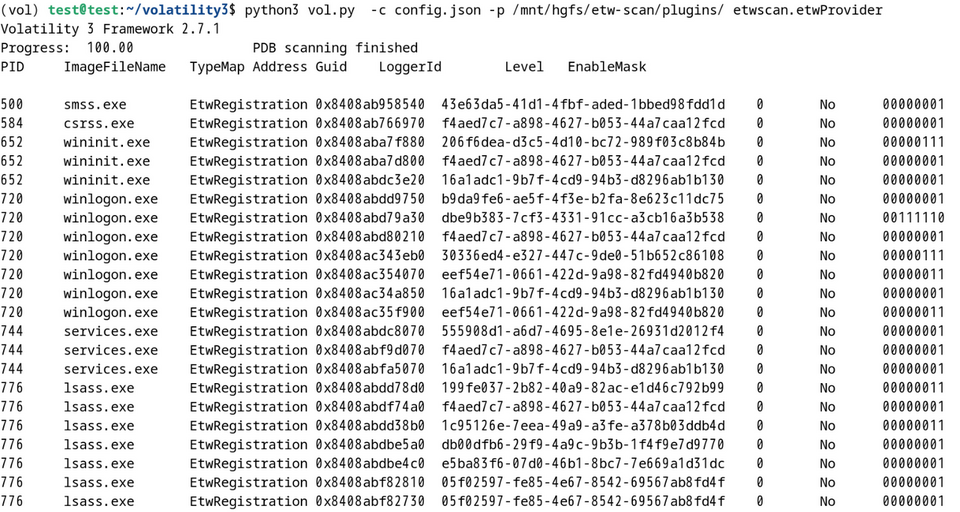
You can download this plugin from the following GitHub repository. We hope you find it useful.
GitHub: JPCERTCC/etw-scan
https://github.com/JPCERTCC/etw-scan
Using the recovered ETW event in incident investigations
Now, let’s look at some examples of how to use the recovered ETW events in incident investigations. To recover ETW events, specify the option --dump (for GlobalList only) or --alldump (for all members) as follows. The number of ETW events that can be recovered depends on the environment, but as shown in Figure 10, it is possible to recover a large number of ETW events as ETL files.
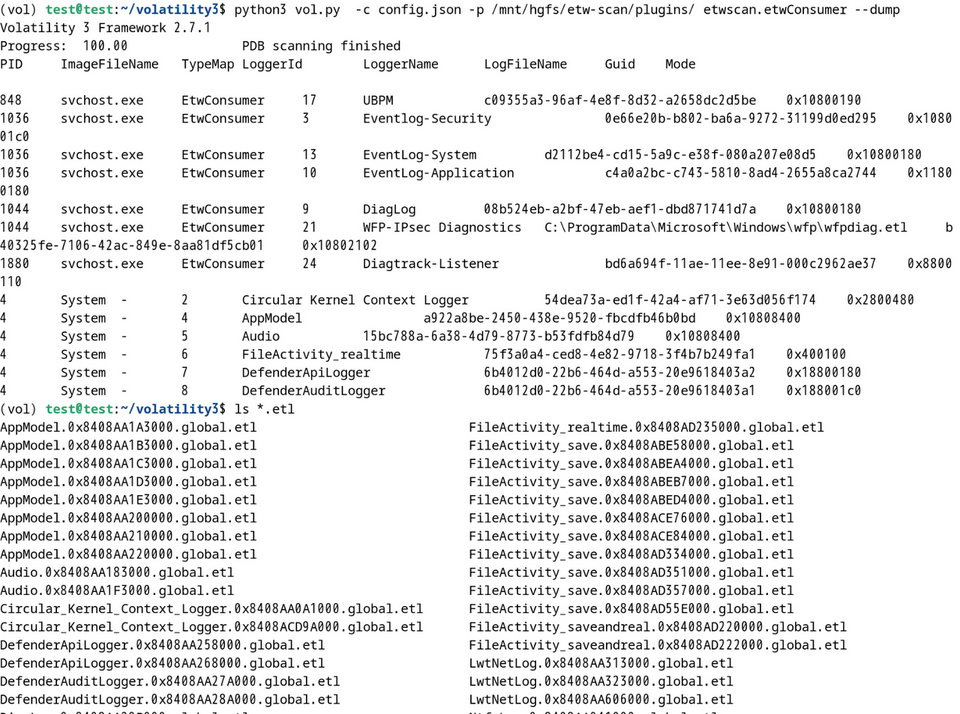
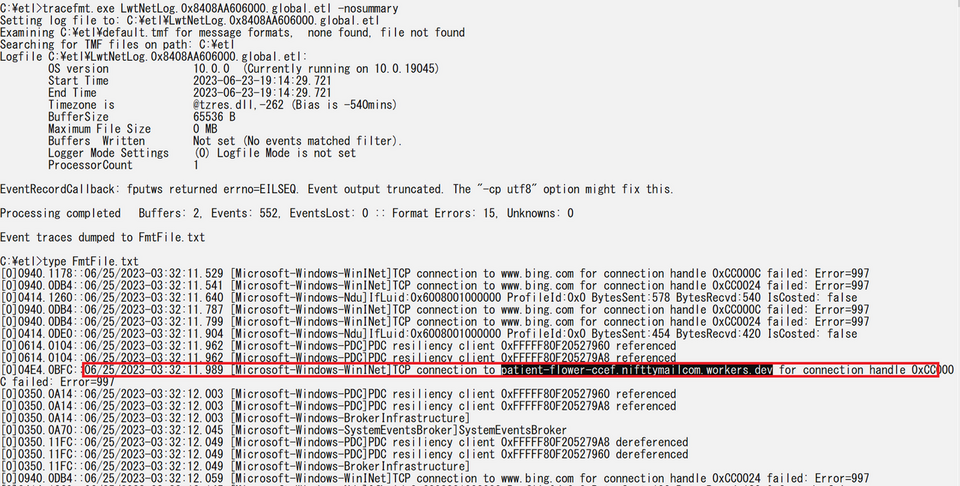
You can parse the recovered ETL file and check for important information. For example, there is an ETW session called LwtNetLog that is enabled by default. This ETW session has multiple network-related ETW providers configured, and it collects various types of information, including communication packets, DNS access, and DHCP. Check the recovered ETW events, and you can see the destination where the malware communicates, as shown in Figure 11. To parse the ETL file, we used tracefmt[4] This tool is not installed by default, and so you will need to install it manually.
Furthermore, if EDR or antivirus software is installed, you may be able to recover the ETW events that these applications were trying to collect. Since each application tries to collect data from different ETW providers, there may be some differences, but still there is a possibility that useful ETW events such as Microsoft-Windows-Threat-Intelligence are recovered.
In closing
On Windows OS, it is possible to collect various information using ETW by default. Although we did not introduce it this time, it is also possible to monitor the system by creating a simple EDR that combines the information collection capabilities of ETW with detection logic. You can try using ETW for system monitoring and incident response.
Shusei Tomonaga
(Translated by Takumi Nakano)
References
[1] Microsoft: Event trace
https://learn.microsoft.com/en-us/windows/win32/etw/about-event-tracing
[2] Microsoft: logman
https://learn.microsoft.com/en-us/windows-server/administration/windows-commands/logman
[3] Geoff Chappell, Software Analyst: Kernel-Mode Windows
https://www.geoffchappell.com/studies/windows/km/ntoskrnl/api/index.htm
[4] Microsoft: Tracefmt
https://learn.microsoft.com/en-us/windows-hardware/drivers/devtest/tracefmt


