TSUBAME Report Overflow (Jan-Mar 2022)
This TSUBAME Report Overflow series discuss monitoring trends of overseas TSUBAME sensors and other activities which the Internet Threat Monitoring Quarterly Reports does not include. This article covers the monitoring results for the period of October to December 2021. The scan trends observed with TSUBAME sensors in Japan are presented in graphs here.
Looking back on 2021
Figure 1 shows a comparison and transition of the total number of IP addresses in Japan that sent scan packets and those that presumably started sending packets due to malware infection. This article covers the followings:
- Number of IP addresses that have supposedly been sent by the hosts presumably infected with Mirai or malware created with Mirai source code (hereinafter “Mirai”)
- Number of IP addresses that have supposedly sent GRE packets (hereinafter “GRE”)
- Number of IP addresses that have supposedly sent 445/TCP packets with a specific window size (hereinafter “445/TCP”)
The number of IP addresses in Japan that sent scan packets increased and decreased multiple times. Among them, the percentages of Mirai, GRE, and 445/TCP were always high. It reached about 88%, and the average for the year was about 72%. We believe that various IoT devices, including wireless LAN routers, surveillance cameras, and recorders that are no longer supported, are infected with Mirai and are sending packets. In terms of GRE, the number of source IP addresses increased sharply around September 10. Since then, the number has been slowly decreasing, while multiple increases and decreases were observed. Regarding 445/TCP, the number of source IP addresses decreased sharply around April 14 although we do not know the reason. After that, it repeated increasing and decreasing slowly. The number for each of them above decreased at the end of March and eventually became lower than the average number of the past 12 months.
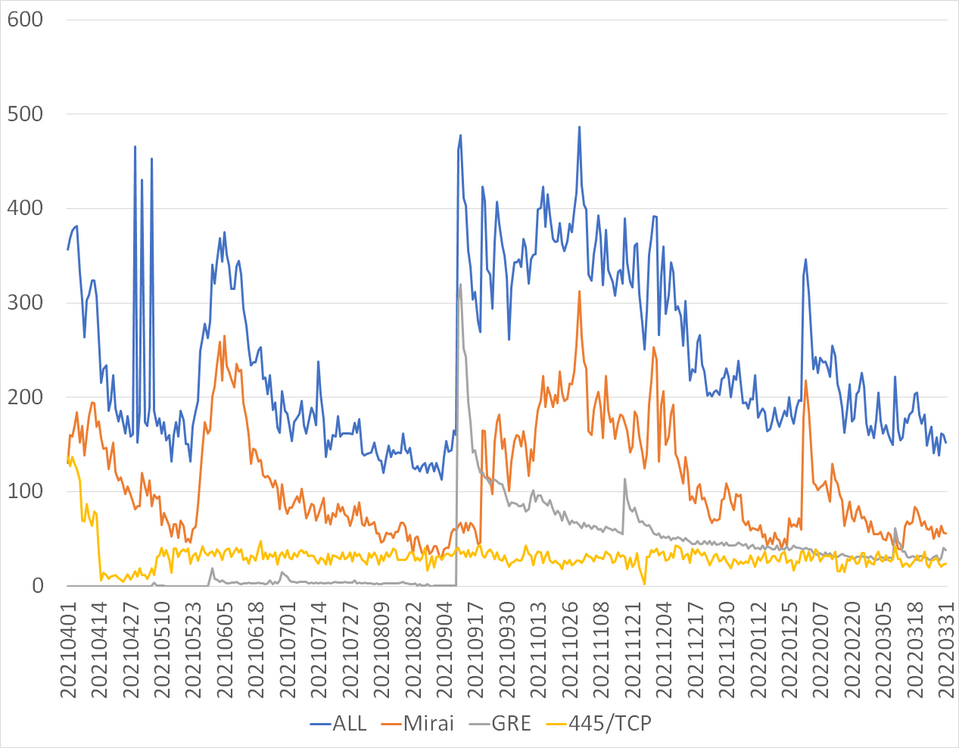
Figure 1. Number of IP addresses in Japan that send scan packets
Comparison of the observation trends in Japan and overseas
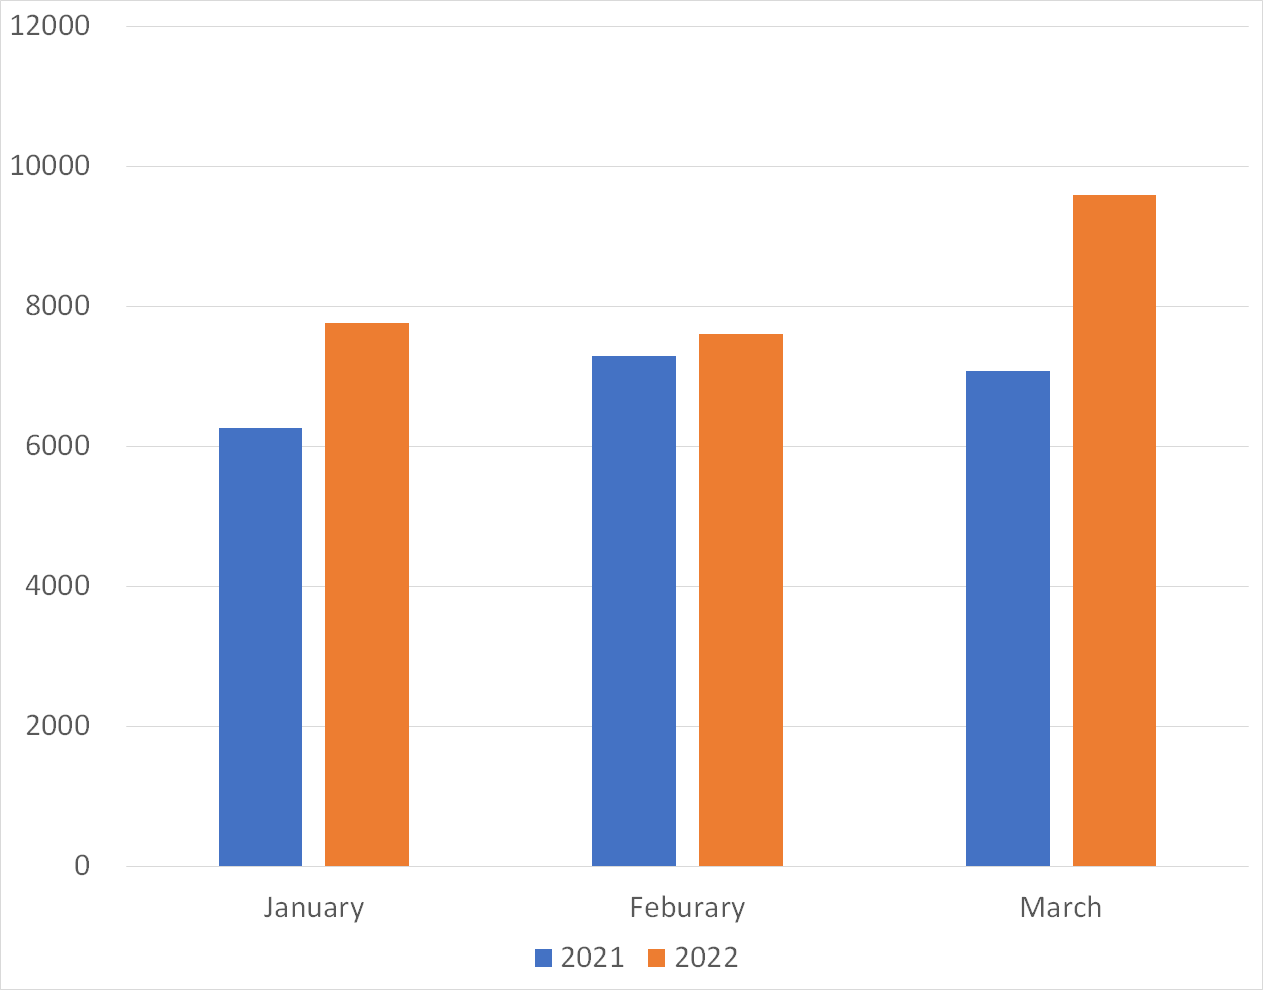
Figures 2 and 3 show a monthly comparison of the daily average number of packets received by a single sensor in Japan and overseas. More packets were observed in the overseas sensors than in the domestic sensors. In March, domestic sensors received more packets than those from overseas. This is because many packets from the U.K. were observed in Japan, Hong Kong, Taiwan, and other countries, as mentioned in the Internet Threat Monitoring Report. Both domestic and overseas sensors received more packets in each of the 3 months than in the same months of the previous year.
 |
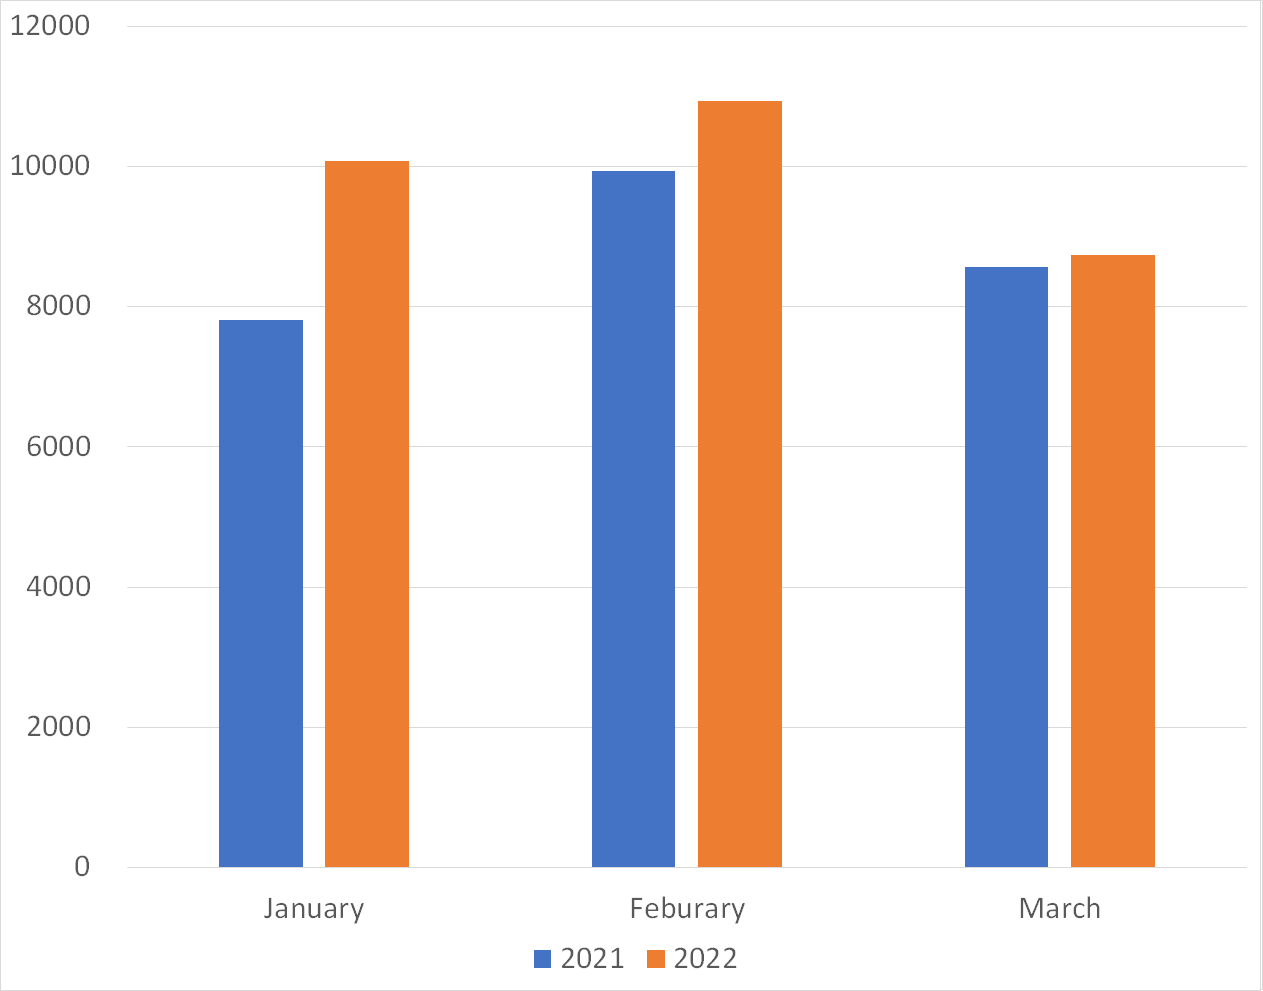 |
| Figure 2: Average number of packets to domestic sensors | Figure 3: Average number of packets to overseas sensors |
Comparison of monitoring trends by sensor
A global IP address is assigned to each TSUBAME sensor. Table 2 shows the top 10 ports of each sensor which received packets the most. Scan packets to port 6379/TCP and 23/TCP, which are used by Redis, and 2375/TCP, which is used by Docker, were observed by all sensors. Although the order is different between the domestic and international sensors, the combinations were not different significantly. This suggests that these protocols are being scanned in a wide range of networks.
Table 1: Comparison of top 10 packets by domestic and overseas sensors
| #1 | #2 | #3 | #4 | #5 | #6 | #7 | #8 | #9 | #10 | |
| Domestic sensor1 | 6379/TCP | 23/TCP | 22/TCP | 445/TCP | 80/TCP | 2375/TCP | 443/TCP | 2376/TCP | 1433/TCP | 5060/UDP |
| Domestic sensor2 | 6379/TCP | 23/TCP | 22/TCP | 445/TCP | ICMP | 80/TCP | 2375/TCP | 2376/TCP | 443/TCP | 123/UDP |
| Domestic sensor3 | 23/TCP | 6379/TCP | 22/TCP | 445/TCP | 123/UDP | 80/TCP | ICMP | 2375/TCP | 443/TCP | 5060/UDP |
| Overseas sensor1 | 6379/TCP | 80/TCP | ICMP | 443/TCP | 2375/TCP | 2376/TCP | 81/TCP | 5555/TCP | 8080/TCP | 5060/UDP |
| Overseas sensor2 | ICMP | 23/TCP | 6379/TCP | 22/TCP | 445/TCP | 7547/TCP | 8291/UDP | 80/TCP | 5555/TCP | 2375/TCP |
| Overseas sensor3 | 445/TCP | 139/TCP | 6379/TCP | 23/TCP | 22/TCP | 123/UDP | 5555/TCP | ICMP | 5060/UDP | 2375/TCP |
In closing
Monitoring at multiple points makes it possible to see whether some trends are unique to a particular network. Regarding Redis, the number has decreased by about 20%, but it is still high. We are planning to clarify the actual situation based on the information obtained from the feedback we receive when we provide information on domestic sources. In this quarter, we did not publish any special security alert or other information, but the attention should be paid to the above issue regarding Redis when using the Internet. We will continue to publish blog articles as the Internet Threat Monitoring Quarterly Report becomes available every quarter. We will also publish an extra issue when we observe any unusual change. Your feedback on this series is much appreciated. Please use the below comment form to let us know which topic you would like us to introduce or discuss further. Thank you for reading.
Keisuke Shikano (Translated by Takumi Nakano)